


The Intelligent Pullback Strategy
In the stock market, most losses do not come from bad companies — they come from bad timing and poor structure. Traders often chase breakouts when prices are extended, or they buy oversold stocks in collapsing downtrends, hoping for a reversal. Both behaviors are driven by emotion rather than probability.
The Intelligent Pullback Strategy is built on structure, confirmation, and discipline. It does not attempt to predict tops or bottoms. Instead, it waits for alignment between trend, momentum, and temporary exhaustion. This alignment dramatically increases the probability of a successful trade while reducing unnecessary risk.
At its core, the strategy follows one principle:
Buy temporary weakness in structurally strong uptrends.
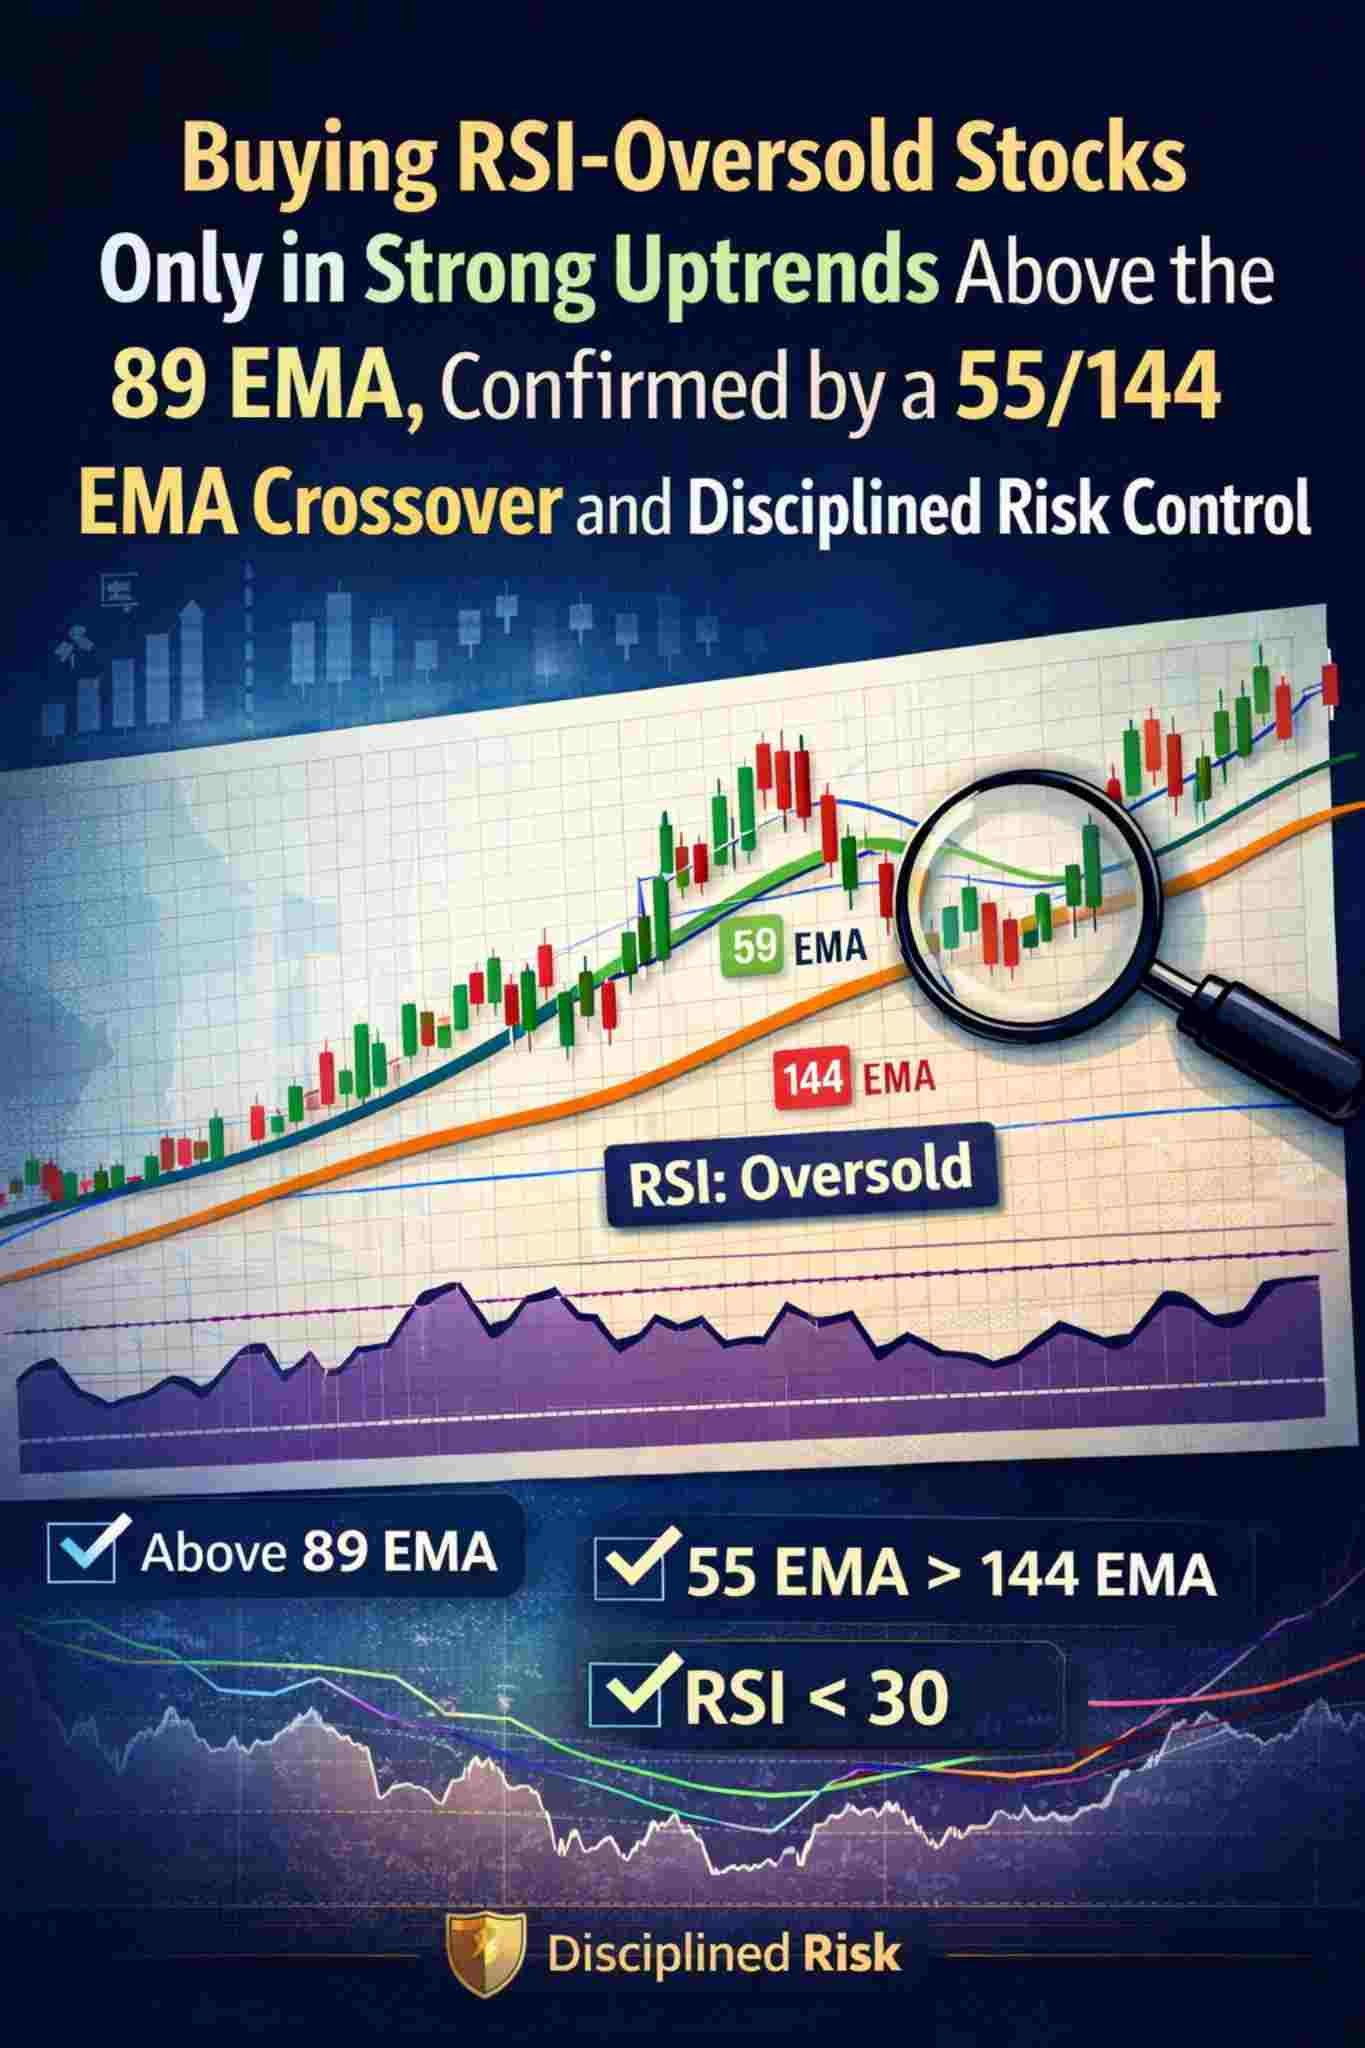
Strategy Chart: EMA + RSI Alignment
Below is a visual representation of the strategy, showing:
- Price above 89 EMA (trend filter)
- 55 EMA above 144 EMA (momentum confirmation)
- RSI pullback below 30 (temporary exhaustion)
1. Why RSI Below 30 Alone Is Dangerous
Many traders believe RSI below 30 automatically signals a buying opportunity. This is one of the most common and costly misunderstandings in technical analysis.
RSI (Relative Strength Index) measures momentum. When it drops below 30, it signals that selling pressure has accelerated and the stock is oversold. However, oversold does not mean undervalued.
In a strong downtrend, RSI can remain below 30 for extended periods. Buying blindly during such conditions is known as “catching a falling knife.” The result is often deeper drawdowns.
The key insight is this:
- RSI below 30 is a condition of exhaustion.
- It is not a standalone buy signal.
- It must be interpreted within trend context.
Oversold in a downtrend is risk.
Oversold in an uptrend is opportunity.
The difference is structural alignment.
2. The 89 EMA – The Structural Trend Filter
The 89 EMA (Exponential Moving Average) acts as a medium-to-long-term structural filter.
When price remains above the 89 EMA:
- The broader trend is bullish.
- Institutional participation is likely present.
- Pullbacks tend to be temporary rather than structural breakdowns.
When price trades below the 89 EMA:
- The market structure weakens.
- Selling pressure dominates.
- Pullbacks may turn into full trend reversals.
The Intelligent Pullback Strategy only allows long entries when price is above the 89 EMA. This condition eliminates trades against the primary trend.
Trend alignment significantly improves probability.
3. The 55/144 EMA Crossover – Momentum Confirmation
Trend alone is not enough. We must also confirm momentum.
The crossover of the 55 EMA above the 144 EMA acts as a momentum trigger. When this crossover occurs:
- Short-to-medium-term momentum strengthens.
- Buyers gain control.
- The probability of trend continuation increases.
This crossover confirms that the uptrend is supported by expanding participation.
Therefore, the strategy requires:
- Price above 89 EMA
- 55 EMA crossing above 144 EMA
Only after these conditions are met does RSI below 30 become meaningful.
4. The Power of Alignment
The Intelligent Pullback Strategy is built on triple confirmation:
- Structural Trend (Price above 89 EMA)
- Momentum Confirmation (55 EMA > 144 EMA)
- Temporary Exhaustion (RSI below 30)
When all three align, probability increases.
This alignment means:
- The market structure is bullish.
- Momentum supports continuation.
- Sellers are temporarily exhausted.
This is the ideal moment to enter.
5. Why Buying Pullbacks Beats Buying Breakouts
Many traders chase breakout candles when price is extended far above moving averages. While breakouts can work, they often occur when RSI is already high, increasing the risk of short-term pullbacks.
The Intelligent Pullback Strategy does the opposite:
- It waits for controlled retracement.
- It enters near support zones.
- It reduces emotional buying at highs.
Buying pullbacks improves risk-to-reward ratio.
If entry is closer to support and moving averages, stop-loss levels can be tighter and better defined.
6. Risk Management – The Core of Sustainability
No strategy guarantees profit. Risk control determines survival.
The Intelligent Pullback Strategy includes:
Position Sizing
Risk only 1–2% of capital per trade.
Stop-Loss Placement
Place stop below recent swing low or below the 89 EMA.
Avoid Overexposure
Do not concentrate capital in one stock.
Respect Market Conditions
If the broader market is weak, reduce position size.
Risk management converts strategy into sustainability.
7. Practical Example of the Strategy in Action
Imagine a stock in a strong uptrend:
- Price consistently trades above the 89 EMA.
- The 55 EMA recently crossed above the 144 EMA.
- RSI drops to 28 during a pullback.
At this moment:
- Structure remains bullish.
- Momentum remains intact.
- Selling pressure shows exhaustion.
This is not weakness.
It is controlled retracement within strength.
That is where intelligent entries occur.
8. The Psychological Advantage
This strategy improves emotional control.
It prevents:
- Buying panic drops in weak markets.
- Chasing hype candles.
- Overtrading random RSI signals.
It encourages:
- Patience.
- Structured thinking.
- Discipline over emotion.
Markets reward discipline more than intelligence.
9. Why This Is Probability-Based Investing
The strategy does not predict the future. It increases probability.
Probability improves when:
- Multiple independent indicators align.
- Trend and momentum agree.
- Risk is controlled.
The Intelligent Pullback Strategy is about stacking favorable conditions.
Over time, consistent probability alignment produces sustainable returns.
10. When Not to Use This Strategy
Avoid this setup when:
- Price is below the 89 EMA.
- 55 EMA is below 144 EMA.
- The broader market is in strong downtrend.
- Volume confirms heavy institutional selling.
Not every oversold reading is a buy opportunity.
Discipline means waiting.
11. Long-Term Perspective
This strategy works best in:
- Swing trading
- Position trading
- Trend-following investing
It aligns better with structured portfolio growth rather than random day trading.
Used correctly, it allows investors to:
- Enter strong stocks at favorable prices.
- Reduce emotional mistakes.
- Maintain capital discipline.
12. Final Principle
The Intelligent Pullback Strategy is built on one simple philosophy:
Buy strength at temporary weakness, not weakness in structural decline.
RSI below 30 signals exhaustion.
89 EMA confirms structural trend.
55/144 EMA crossover confirms momentum.
Risk control protects capital.
When these elements align, probability improves.
Success in the stock market is not about constant activity. It is about selective participation when structure supports your decision.
The disciplined investor waits.
The emotional trader reacts.
Over time, discipline wins.


